Back to work

Our founder’s work

Case study · Operational intelligence

Seeing riskbefore it becomes reality.

Britt designed a weather intelligence platform to help a major electric utility make faster, safer decisions in one of the most wildfire-prone regions in the United States — turning thousands of data points into a tool teams could read at a glance.

Client
Major electric utility
Year
2019
Scope
Research · Product Strategy · UX Design · Visual Design
Region
Southern California
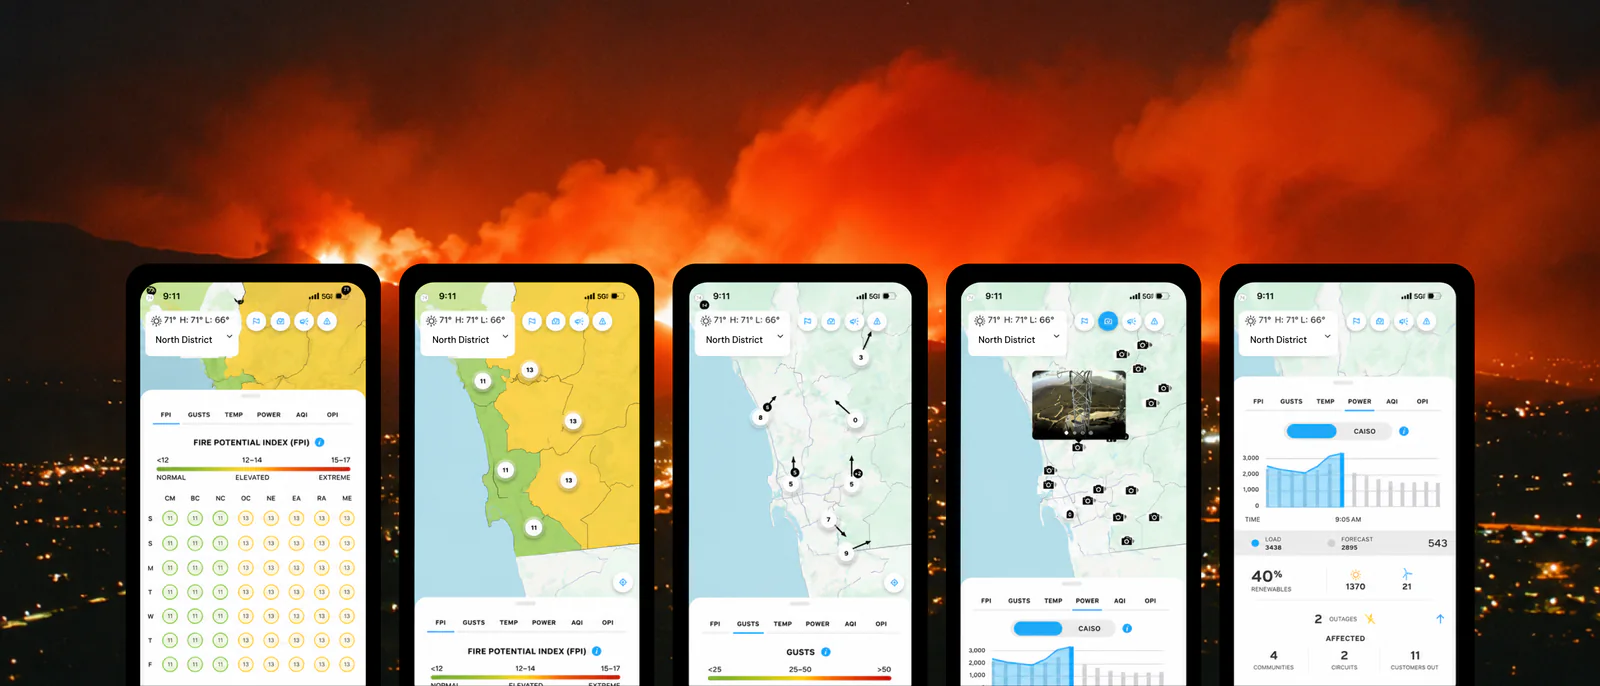
Five phone screens showing the weather intelligence platform — fire potential index, wind and humidity maps, and power indicators — against a wildfire sky.

One operational view: fire potential, wind, humidity, and grid indicators — read at a glance against the conditions they describe.

Read conditions. Surface risk. Decide faster.

01

Weather as operational risk

For a utility responsible for critical infrastructure, changing conditions aren't a forecast. Wind, heat, humidity, and dry vegetation are operational risk — shaping where crews deploy, what equipment gets watched, and when to act.

02

Clarity at a glance

The challenge wasn't displaying weather data. It was transforming thousands of data points into a decision-making tool field teams, meteorologists, and operations leaders could understand instantly.

03

Lower the risk

The goal was clear: improve situational awareness and ultimately help reduce wildfire risk across the region.

Designed for action,not observation.

Before designing a screen, Britt interviewed both ends of the problem: the internal meteorology team, on which signals genuinely influenced operational decisions, and the field crews maintaining infrastructure across the region. The crews didn’t want dashboards or scientific reports. They needed to know where conditions were changing and what required attention right now.

So this isn’t another weather application, it’s an operational intelligence platform. Fire potential, top wind gusts, humidity, temperature, wind speed and direction, alerts and geographic conditions sit in one interface with live maps, so critical information surfaces first and the supporting detail stays a layer away. The design didn’t simplify the science. It simplified access to it.

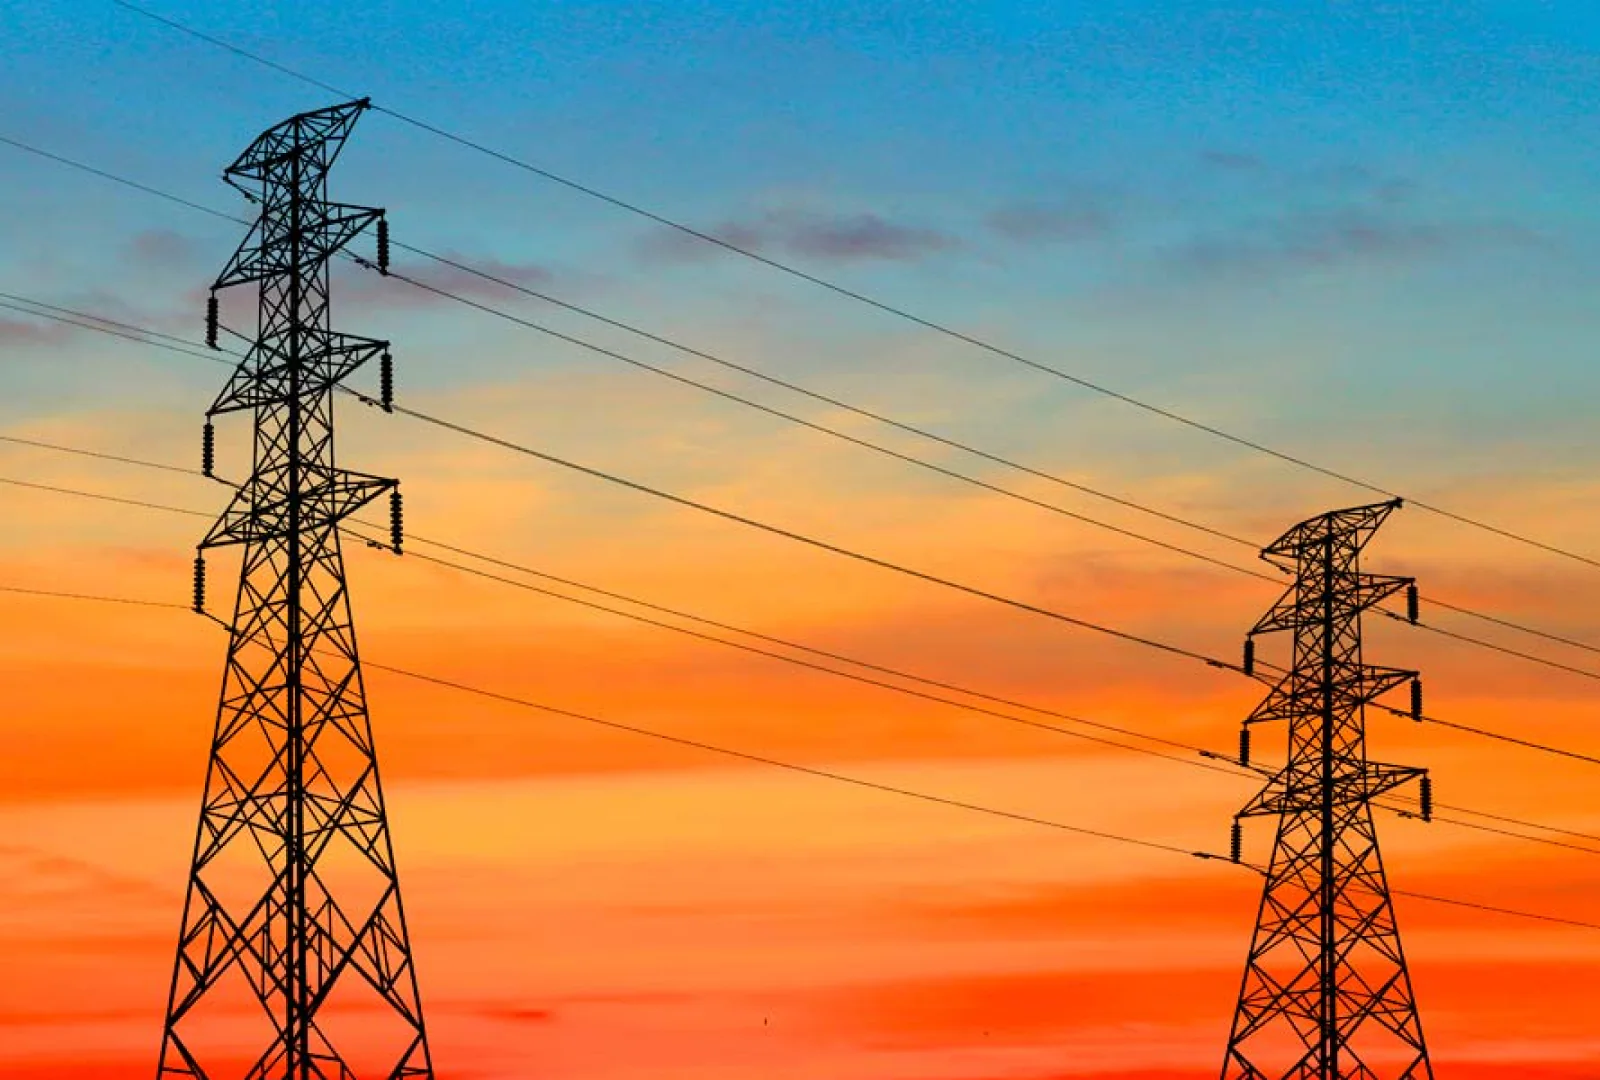
Electrical transmission towers silhouetted against a deep orange sunset sky.
Critical infrastructure at dusk — the operational reality the platform was built to help protect.

What it delivered.

  • 01

    Intelligence built around decisions

    A unified experience combining weather data, wildfire indicators, and environmental conditions into a single operational platform.

  • 02

    Research-driven strategy

    Interviews with meteorologists and field workers directly informed the product architecture — reflecting real operational workflows instead of assumptions.

  • 03

    Faster situational awareness

    Fire potential, wind conditions, humidity, and other critical indicators became immediately visible, so teams could read changing conditions more quickly.

  • 04

    Supporting wildfire mitigation

    The platform contributed to the organization's broader wildfire-prevention strategy by improving visibility into the environmental conditions that drive operational risk across the region.

Have complex data that needs to become decisions?

Start a Project